Are Home Prices Rising or Falling in West Town, Chicago?
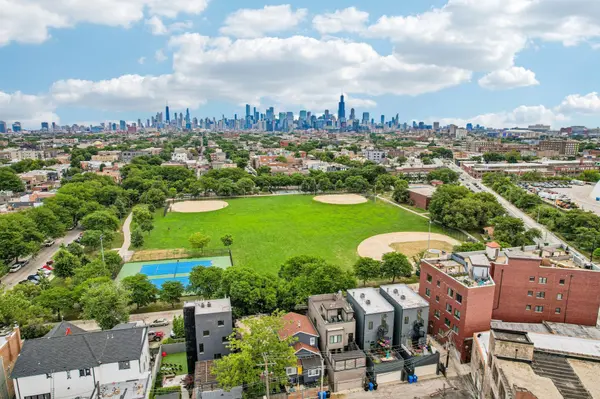
West Town, a neighborhood in Chicago, IL, is a steadily appreciating housing market. Here's why, and what buyers and sellers should know today.

The National Picture
Home prices nationally are rising at a measured pace. The median U.S. sale price reached $399,000 in the three months ending August 2026, a 2% gain over the prior year. For the typical household earning about $88,000, housing now takes up roughly 34% of income, a modest improvement from about 36% last year. Nationwide, about 20% of listings have had a price reduction, supply sits at about four months, and the median time to go under contract is 50 days.
Home Prices in the Chicago Area
The Chicago metro median sale price is approximately $394,000. A typical metro-area household earns close to $99,000 and spends about 35% of income on housing, nearly identical to what it was a year ago. West Town's median of $705,000 sits well above the metro level, meaning buyers here generally need higher incomes or larger down payments to get in.
Steady Gains in a Competitive Market
West Town's median sale price rose 7% year over year to $705,000. About 60% of homes sold above asking, and the average sale closed at 103% of list price. Only about 11% of listings have been reduced, and homes sell in a median of 43 days. Neighboring Logan Square is priced slightly lower at $673,000 but saw nearly flat growth, while the broader North Side posted a 12% gain.
Why Are Prices Rising in West Town?
West Town's inventory remains constrained. Active listings barely moved from last year, and there are 1.7 months of supply on the market. New listings rose 13% and pending sales climbed 10%, which means the additional supply is being absorbed almost as fast as it appears. Homes are selling quickly and above asking, leaving little room for buyers to negotiate — conditions that continue to push prices higher.
| Neighborhood | Median Price | Price YoY | Price Drops | Months of Supply |
|---|---|---|---|---|
| West Town ★ | $704,660 | 6.8% | 10.6% | 1.7 |
| North Side | $719,653 | 12.4% | 9.1% | 1.6 |
| Logan Square | $672,675 | 0.7% | 12.3% | 1.9 |
| North Shore | $764,631 | 3.5% | 16.0% | 2.1 |
| Central Chicago | $439,788 | 4.7% | 16.4% | 2.5 |
| Downtown Chicago | $439,788 | 6.0% | 17.0% | 2.6 |
Limited to neighborhoods with at least 10 home sales in the period.
All data comes from Redfin and represents a three-month rolling average ending August 2026. This article has been generated, in whole or in part, using generative artificial intelligence (AI) technology, with input from Redfin head of economics research Chen Zhao. While efforts have been made to ensure the accuracy and reliability of this information, you should independently verify all data, facts, and citations contained in this article before relying on it for any purpose. This information is not a substitute for advice from a real estate agent, financial advisor, or other licensed professional. Check the Redfin Data Center for additional in-depth housing market data.
Categories
Recent Posts